
Back in 2005, one of my computer science teachers told us that most students abandon a page if it takes more than 12 seconds to load. That stuck with me for a long time, but I started paying closer attention in the last two years, since I gave the Web Vitals talk at WebConf.

These days, people have an extremely short attention span—we need fast, constant access to content. Not only because of how much content exists, but also because of how technology has evolved. Because of this, web developers need to obsess over initial page load performance. Spoiler alert: when your site is slow, your users leave.
Let’s do a quick recap before we continue, in case you didn’t make it to WebConf: Google uses Core Web Vitals metrics to determine your site’s ranking.
What are Core Web Vitals?
They are metrics that measure user experience in terms of speed, interactivity, and visual stability. For example:
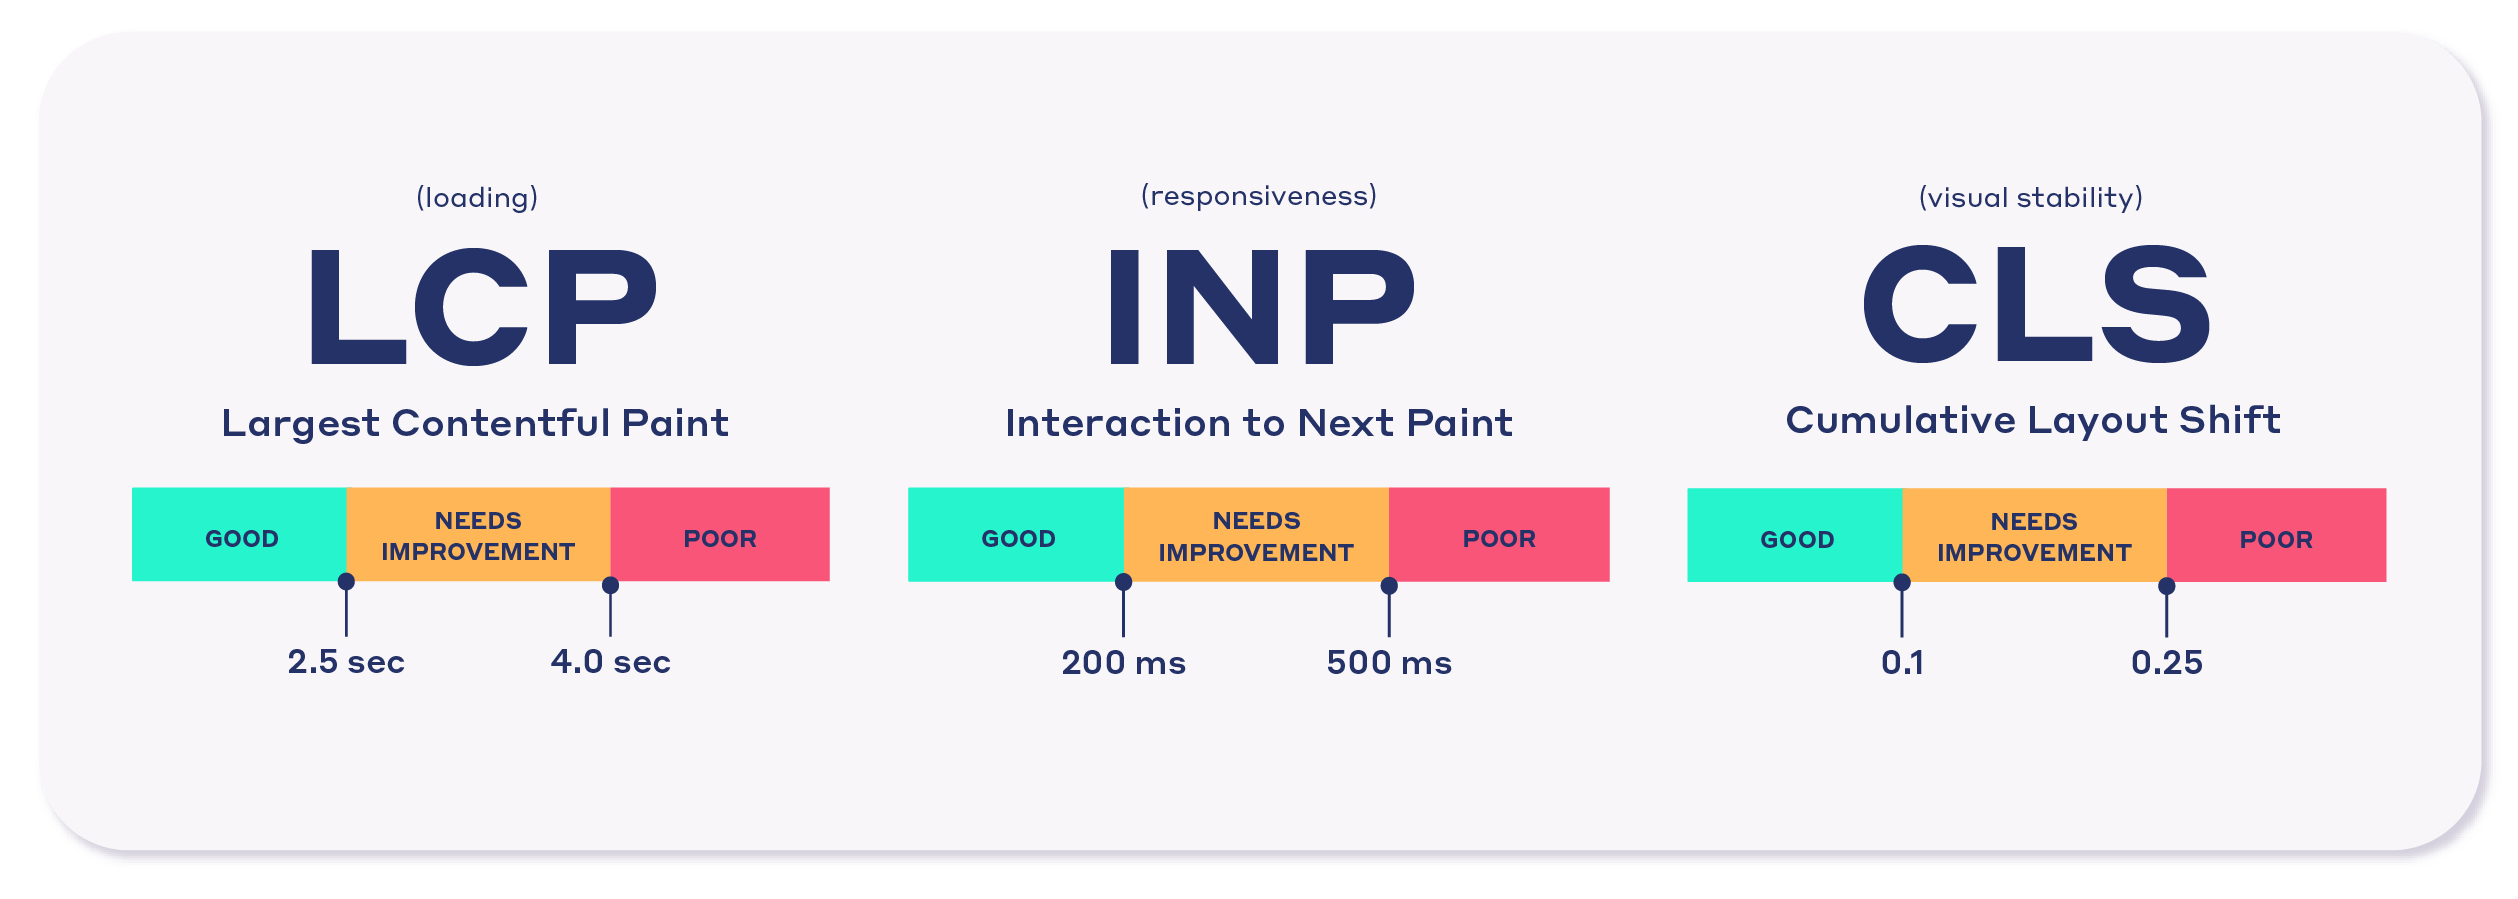
- LCP (Largest Contentful Paint): Measures how long it takes for the most important part of the page to appear (like a large image or a headline).
- FID (First Input Delay): Measures how long the page takes to respond to the user’s first click or interaction.
- CLS (Cumulative Layout Shift): Measures whether page elements move unexpectedly while loading.
Why performance matters
Now, why should you care about frontend performance? Here are a few quick reasons:
-
Users hate waiting. If your page takes more than 3 seconds to load, more than 50% of people leave.
-
Google hates slowness too. Web Vitals metrics are key for SEO.
-
It affects your business. A delay in app load time can reduce sales.
Convinced? Good. Let’s keep going.
Resource optimization
The first step is reducing resource load time.
Images
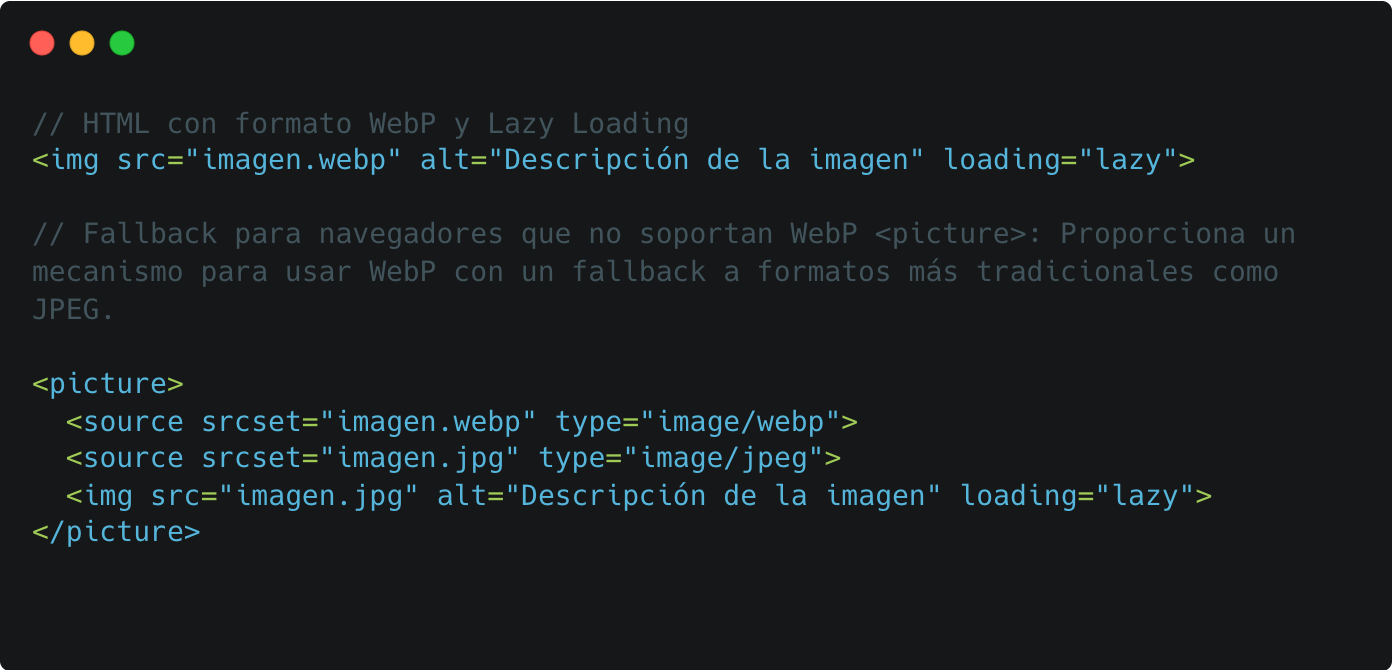
Did you know images are usually the heaviest resource on a page? Use modern formats like WebP to save space without losing quality, and don’t load every image at once—apply lazy loading so they download only when the user needs them.
Fonts
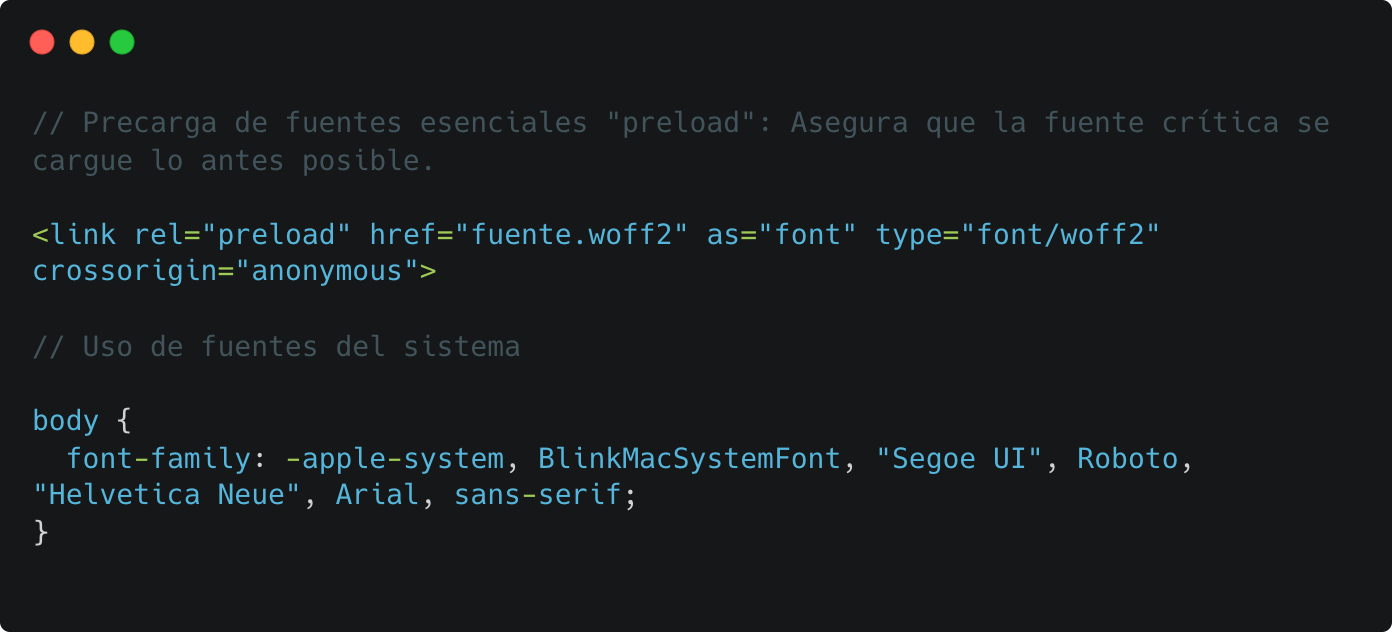
Love custom fonts? Me too. But they can be a problem. Limit how many fonts you use, preload the essential ones, and consider system fonts when possible.
Videos
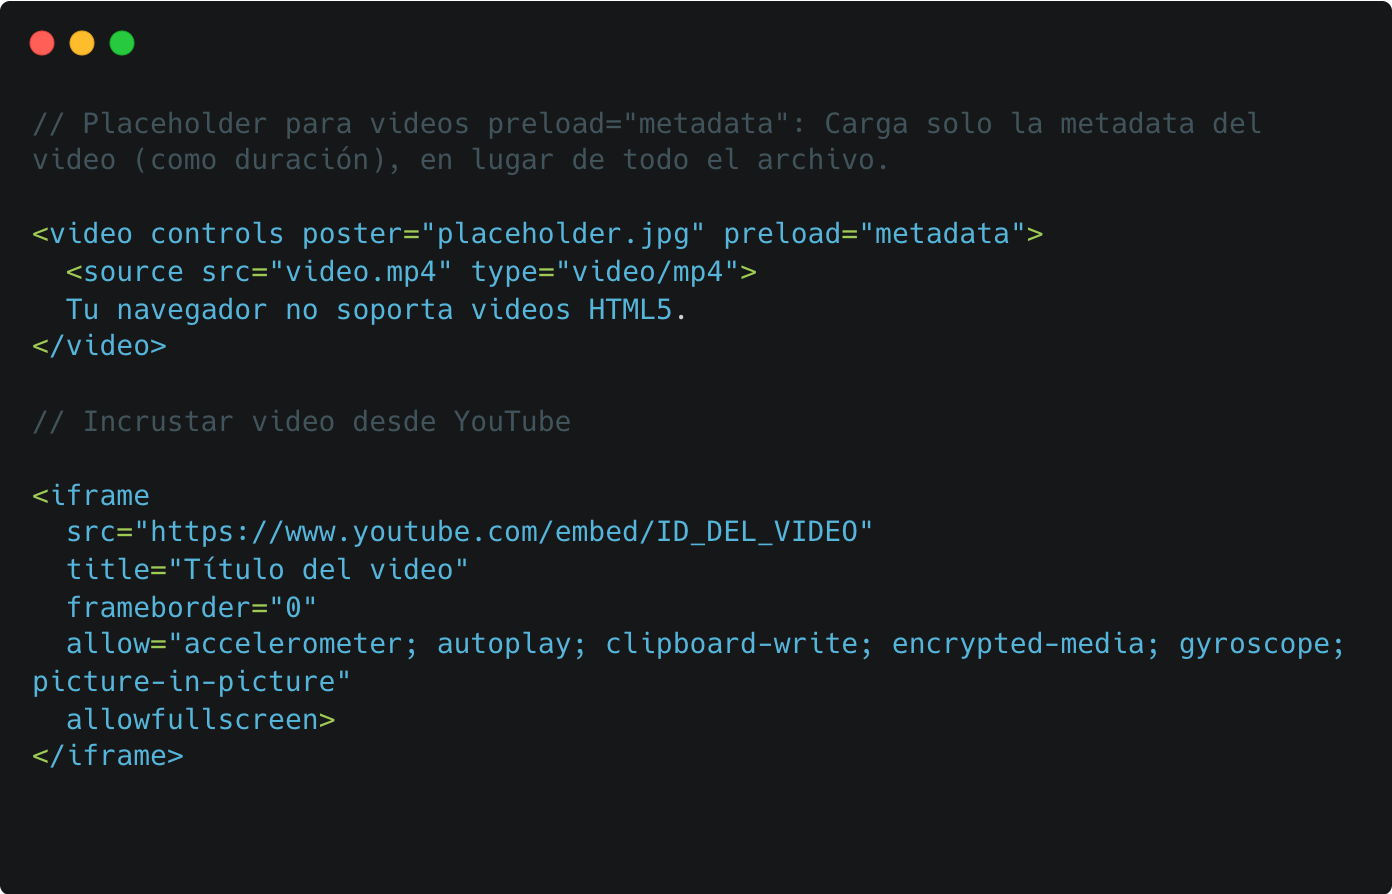
If you have videos on your site, make sure they’re optimized. Use placeholders instead of loading them immediately, and when you can, embed from external services like YouTube.
Efficient loading techniques
This is where things get interesting. There are tons of ways to improve how and when your page resources load.
Suppose we have the following example we want to optimize:
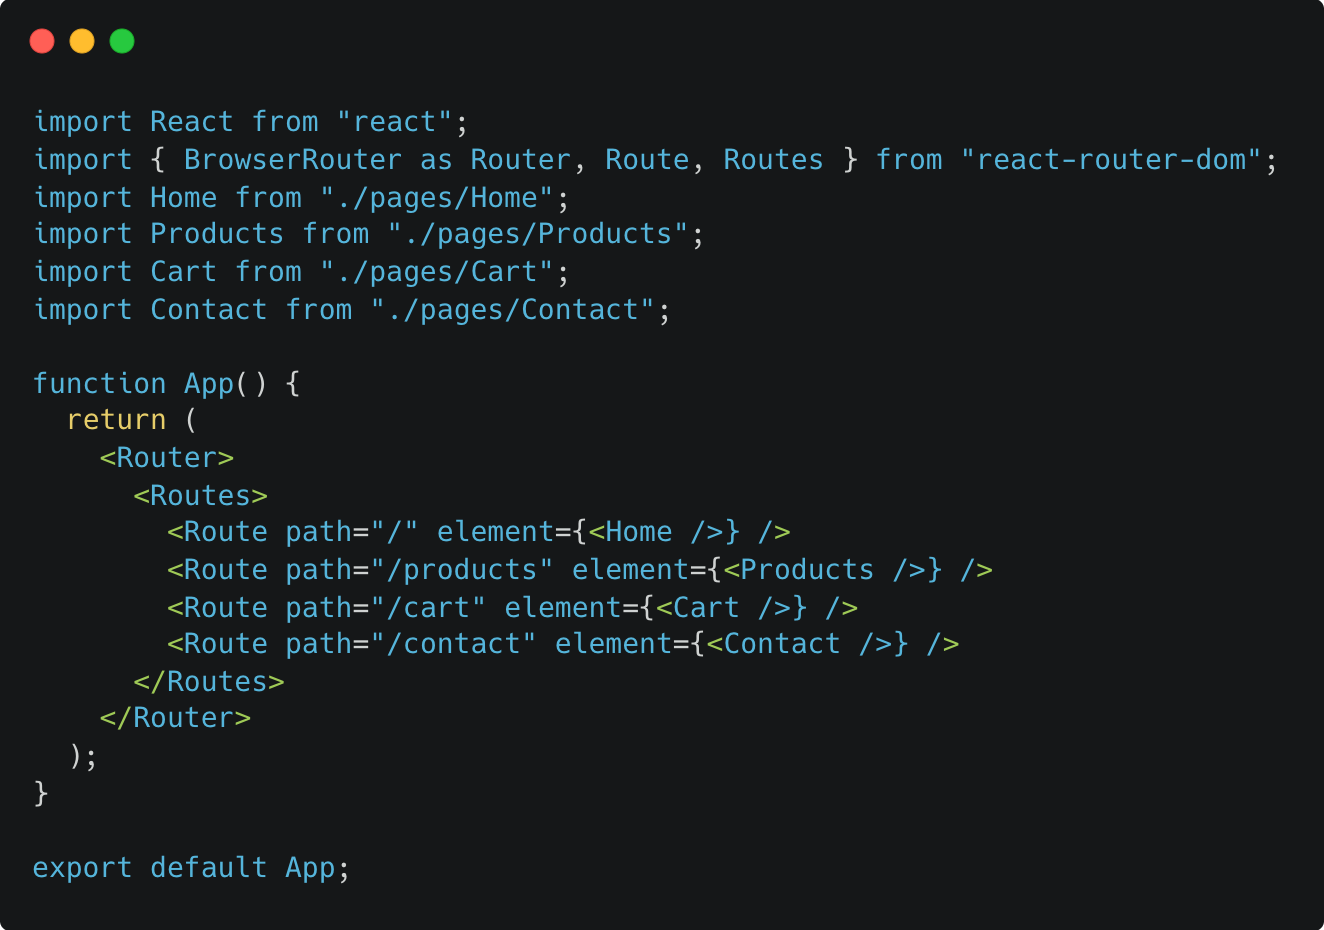
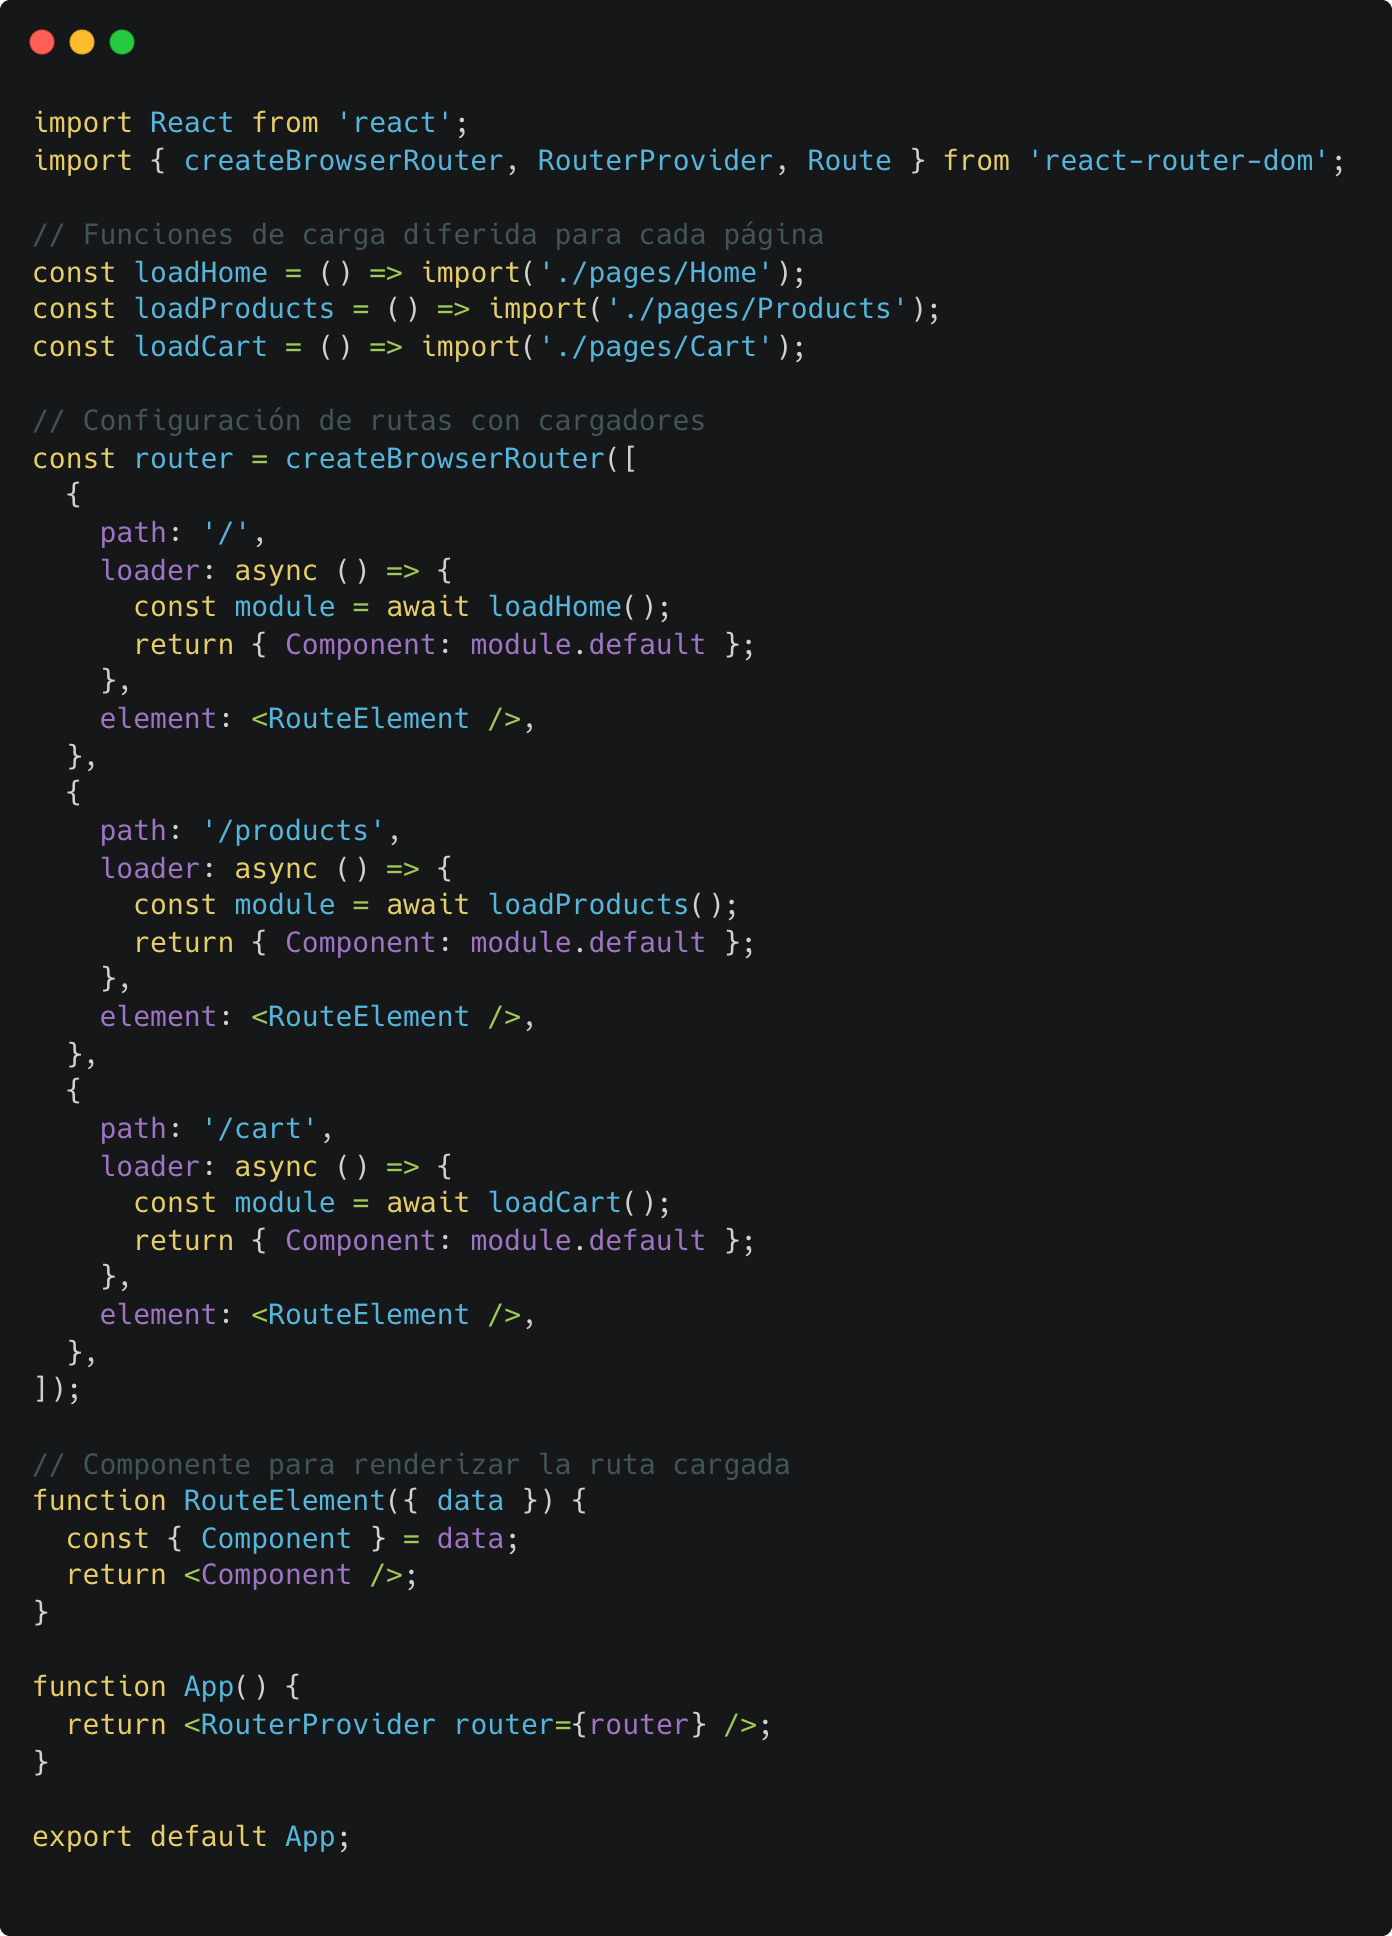
- Code Splitting: split your JavaScript into smaller pieces and load only what you need. For example, use a loader that imports components asynchronously so they load only when you hit that route.
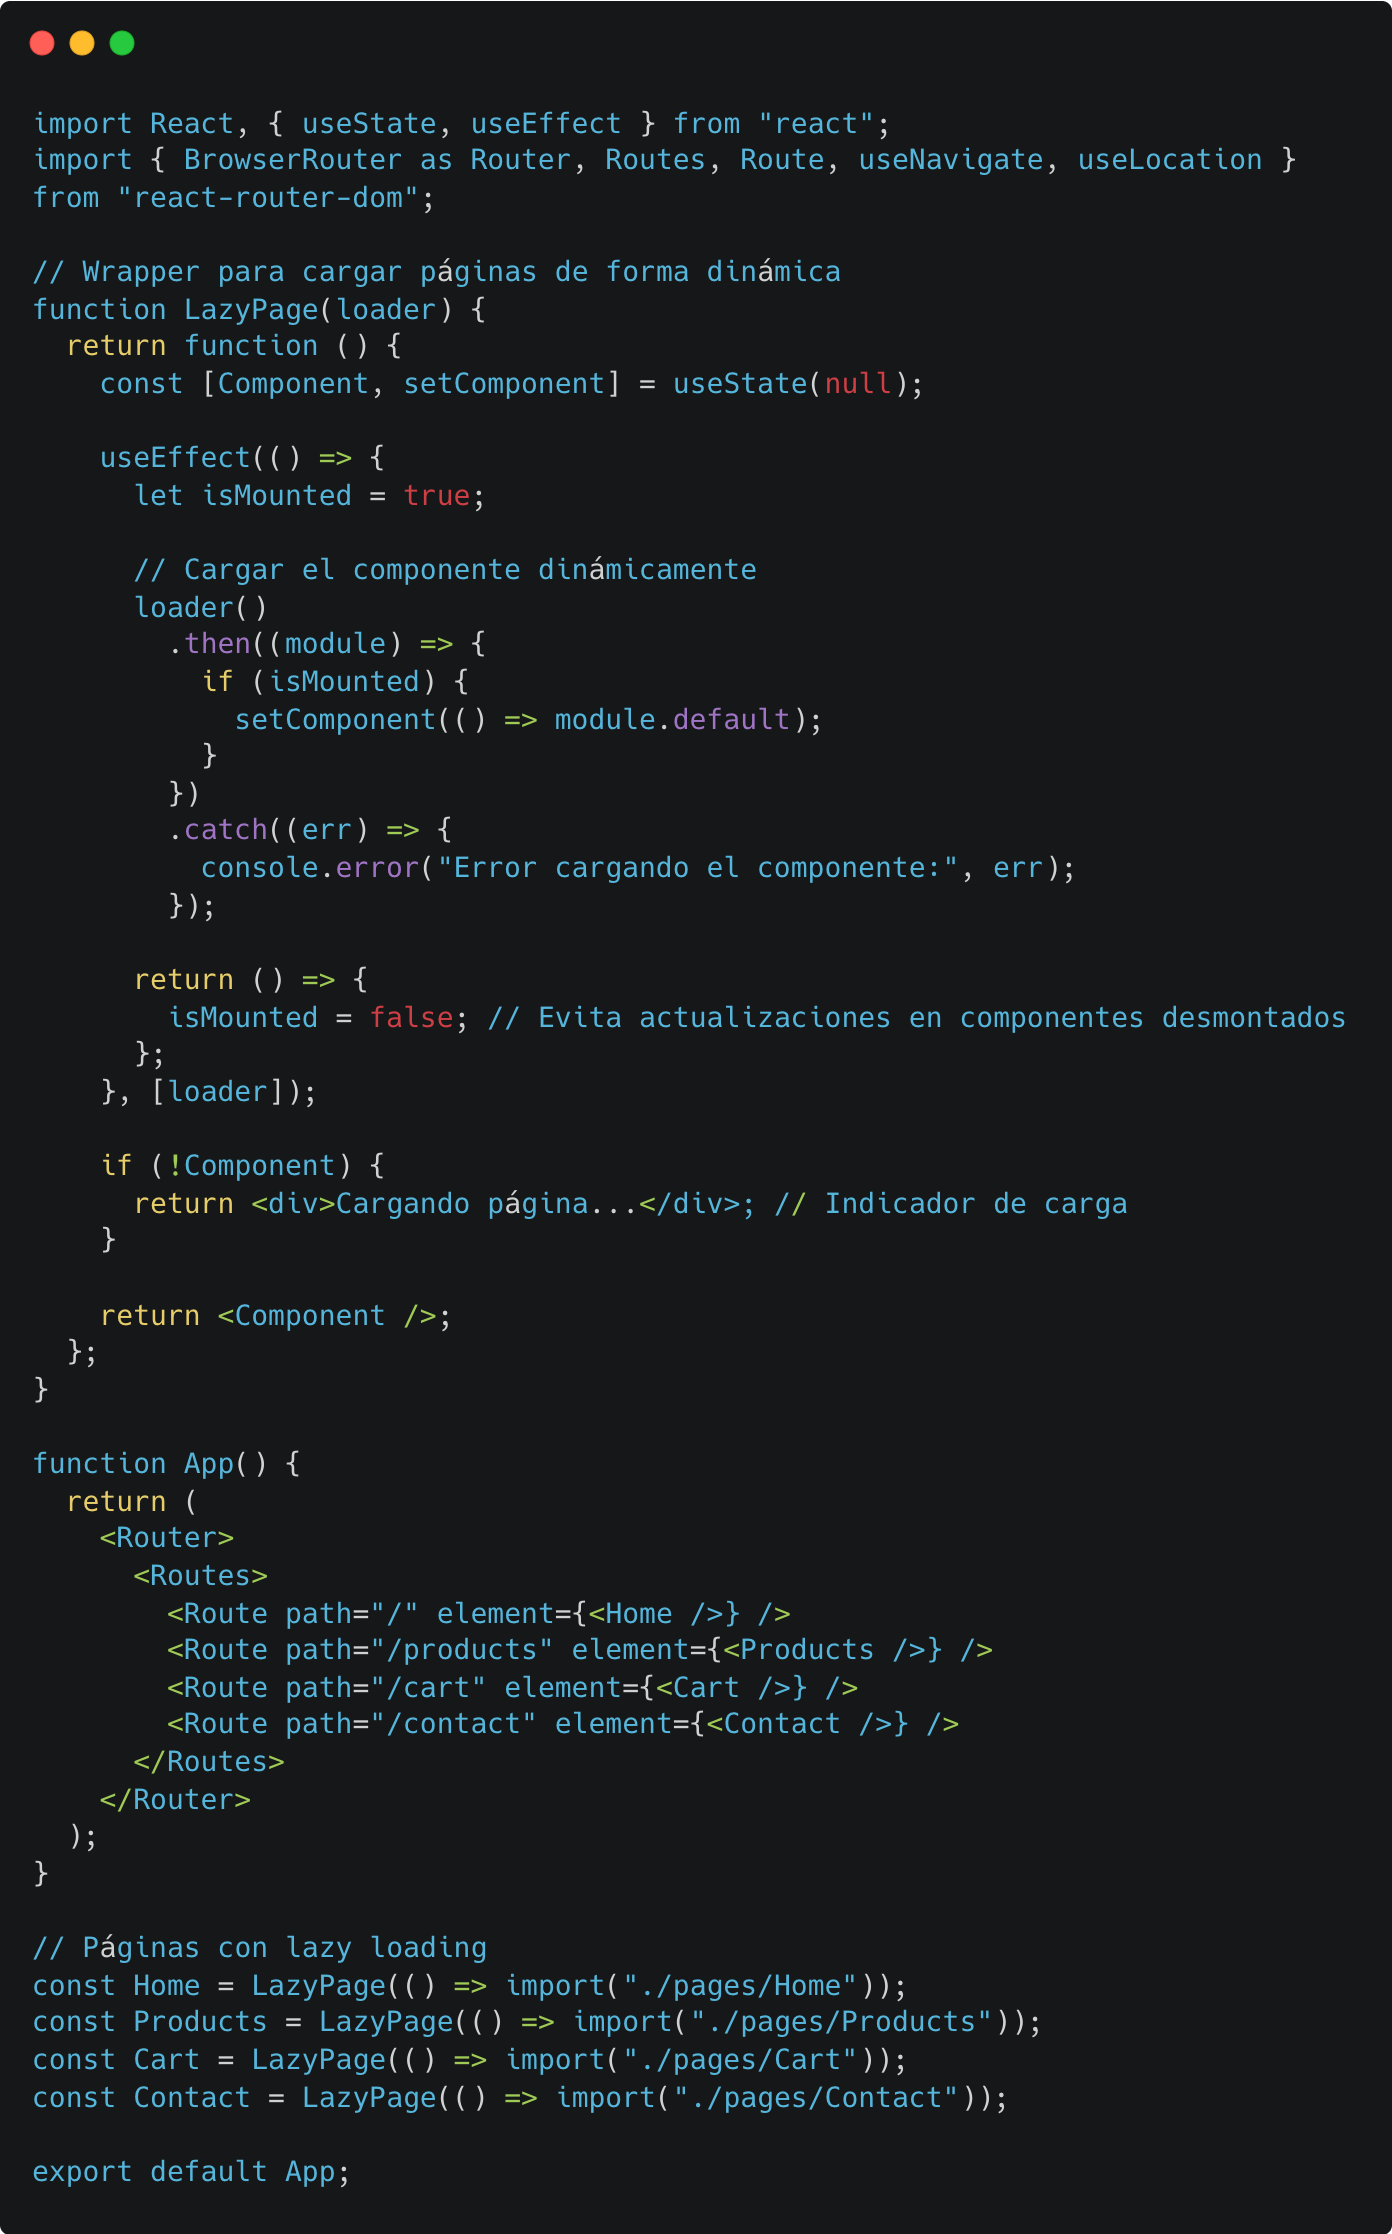
- Lazy Loading: apply this technique to everything you can: images, scripts, components.
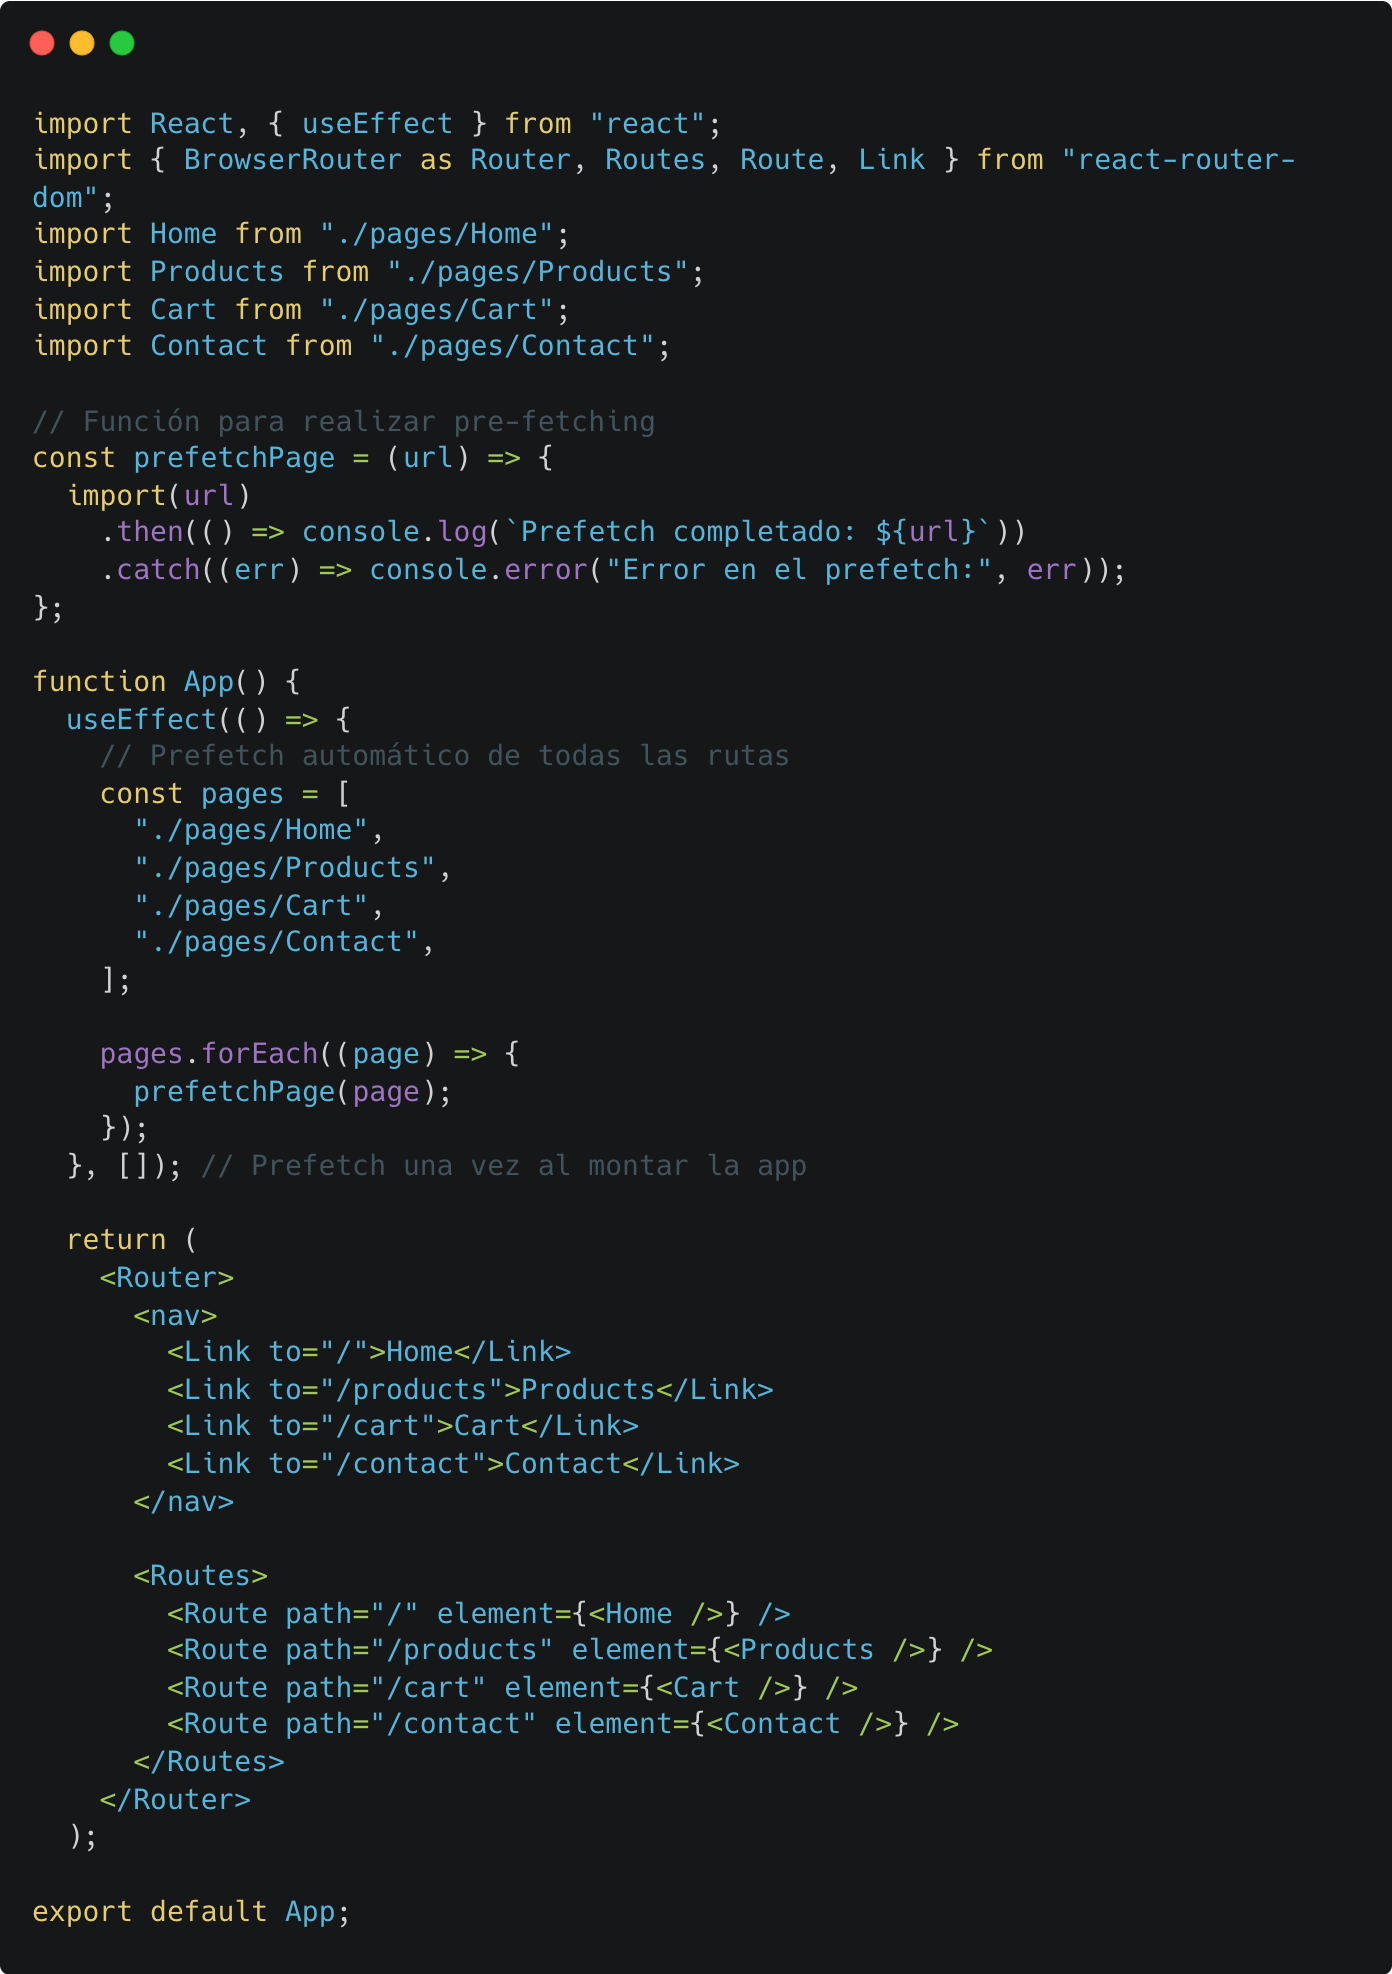
- Prefetching: load resources the user might need later, before they ask for them.
Reducing JavaScript

JavaScript is great, but too much can be a problem. Tree Shaking removes unused parts from the final bundle—functions or modules you never call. Use tools like Webpack or Rollup to analyze your code and automatically detect what you actually need, making apps lighter and faster. Your framework might already be doing this if you use Next or Angular Universal.
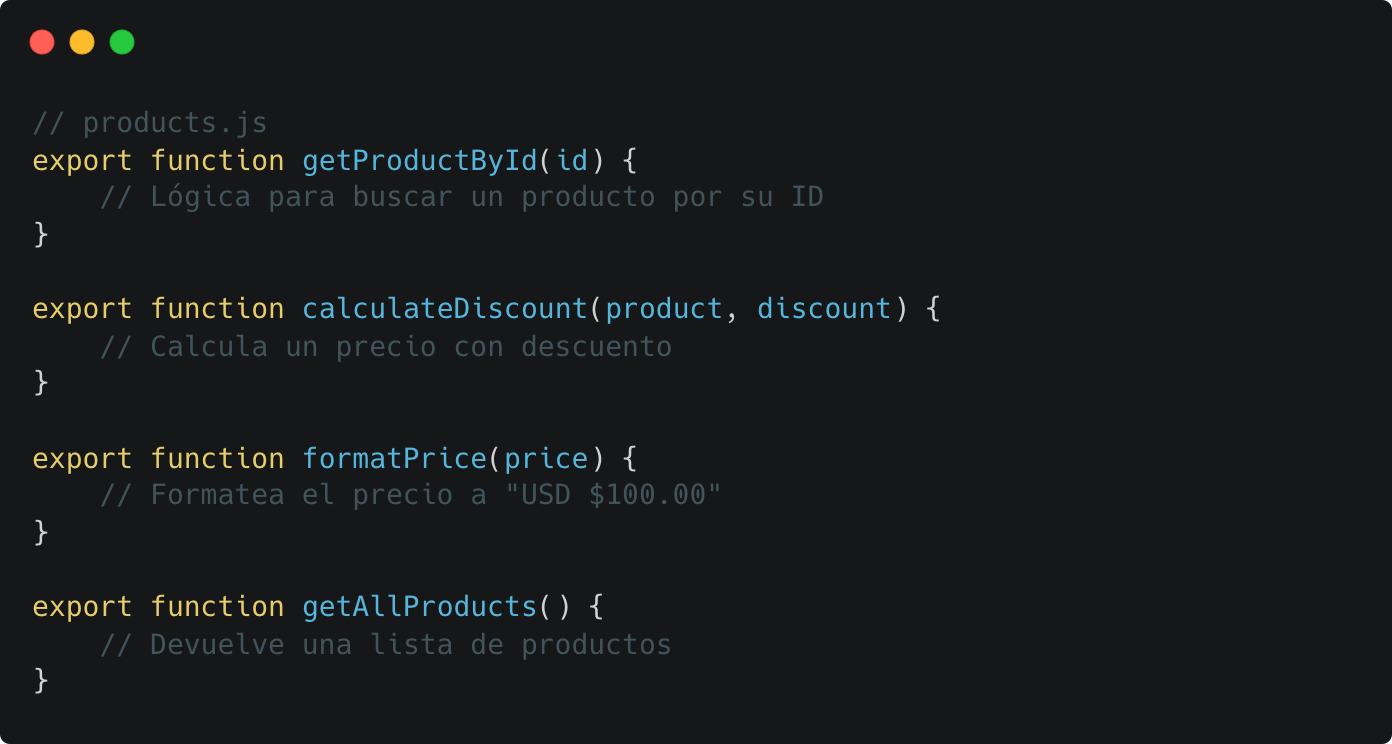
Suppose we have this products.js file in the Utils folder
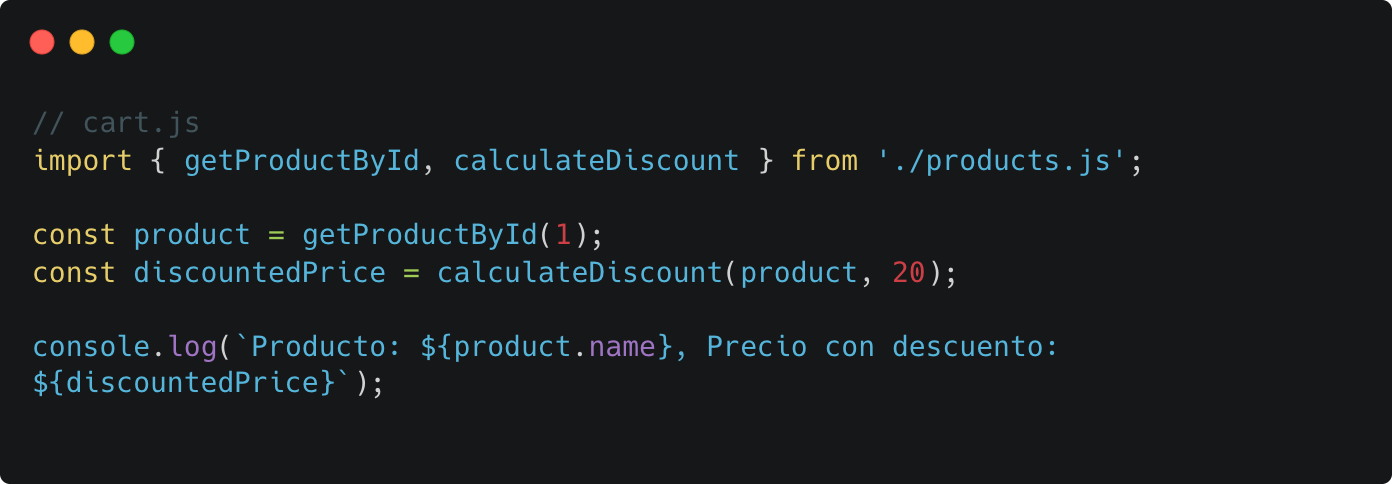
But in cart.js we only call two functions from products.js
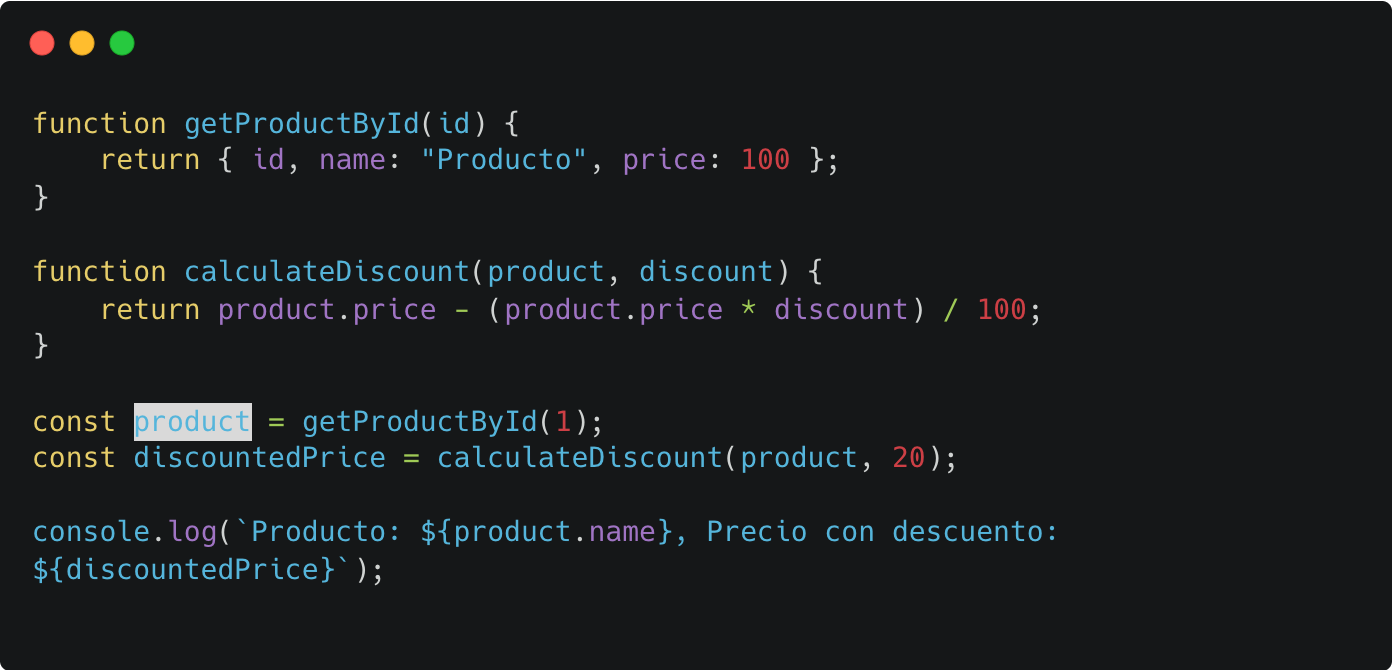
What gets built is only the code we use, discarding the functions we’re not calling from cart.js
Cache
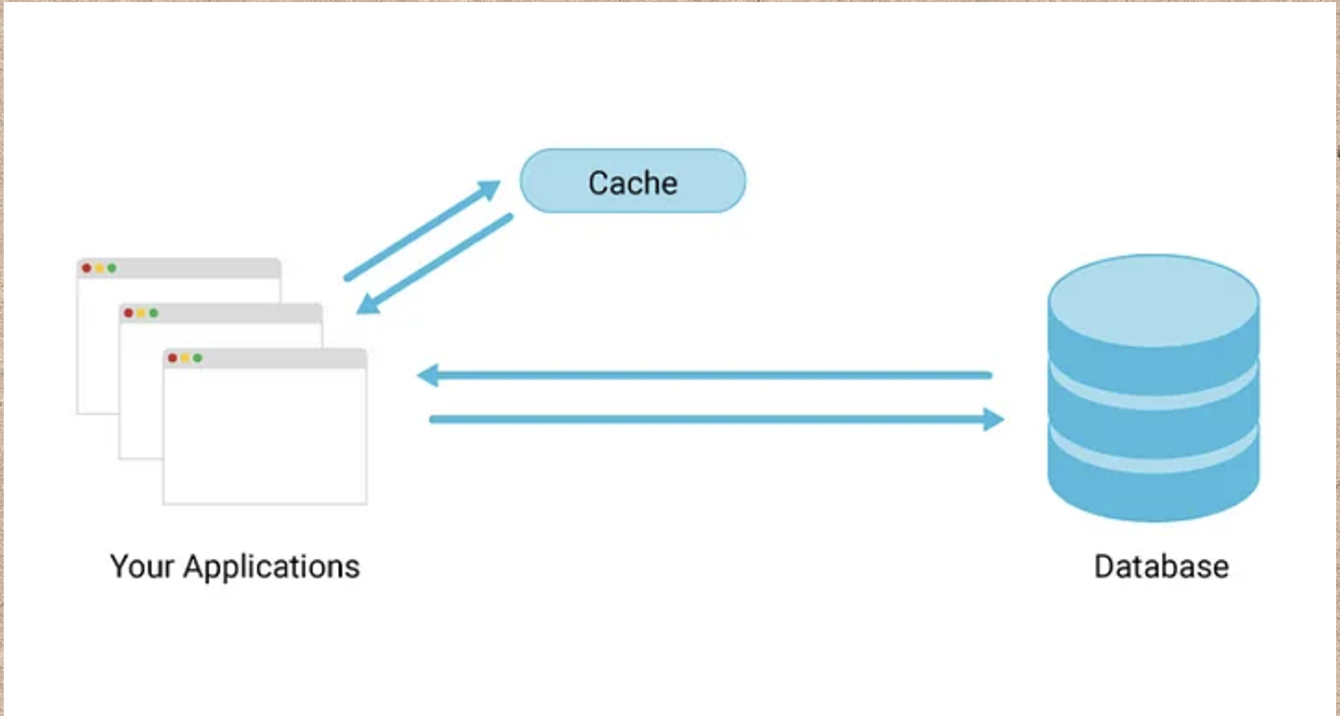
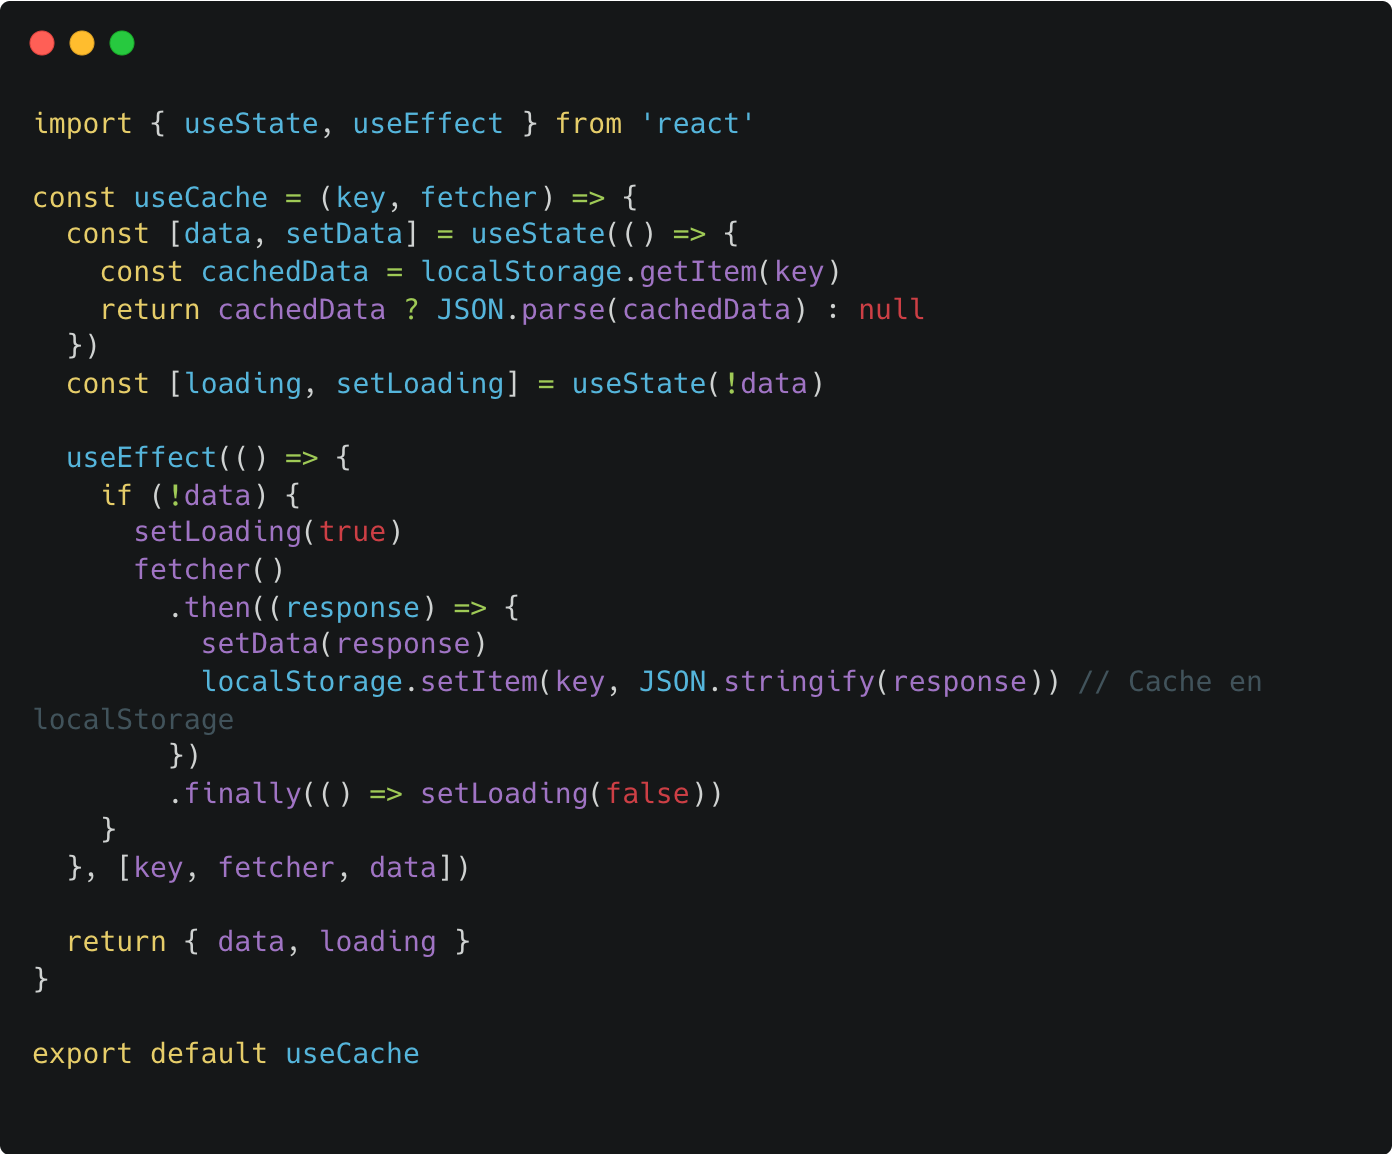
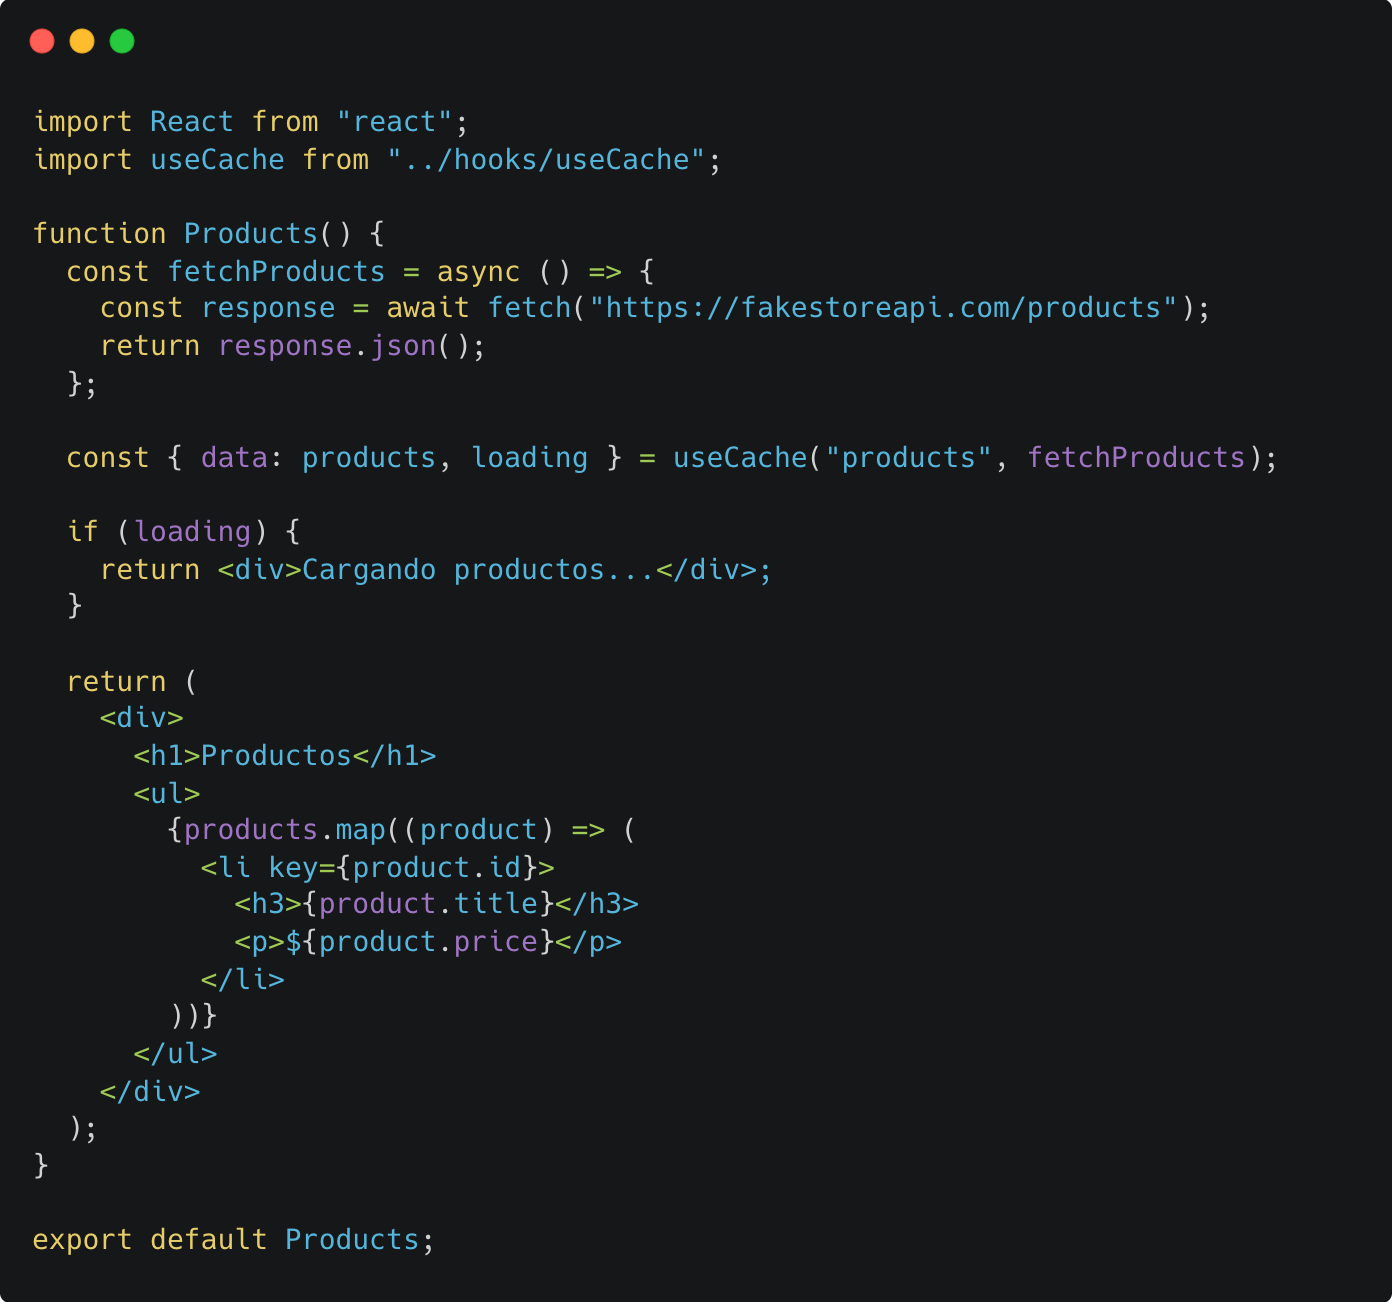
Using the browser cache is like giving users a shortcut. Configure your static resources so they don’t download every time someone visits your page. You can use browser local storage (localStorage) or in-memory storage to save data like products, cart details, or previously loaded pages.
SSR, SSG, and CSR
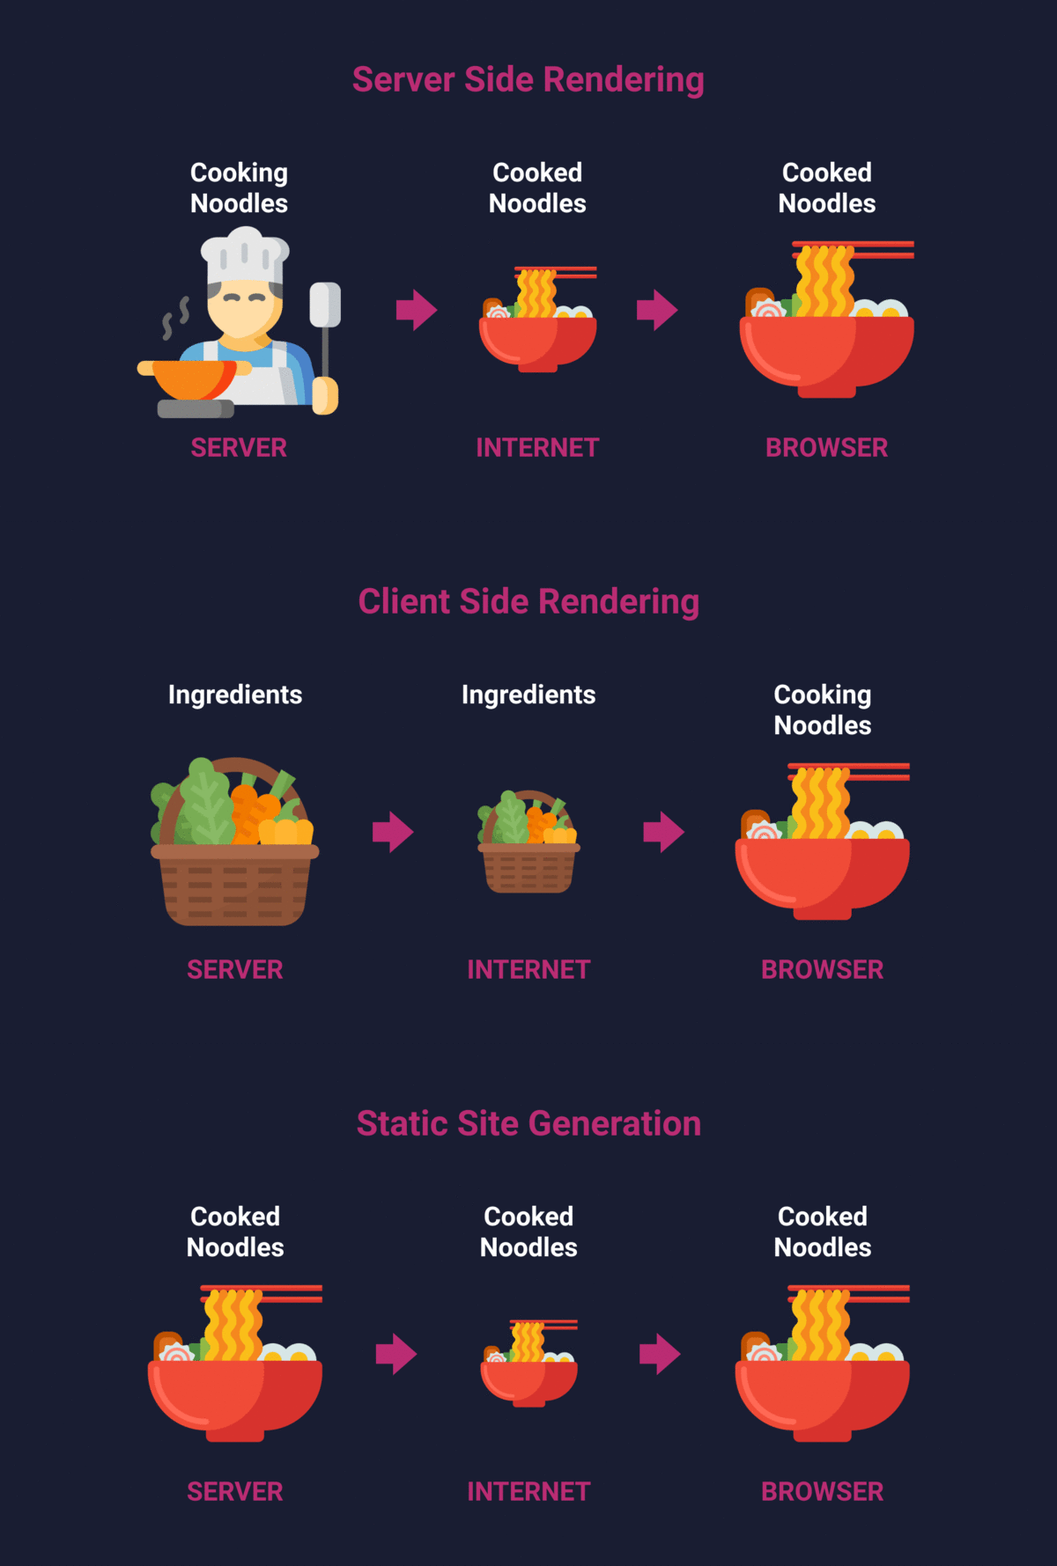
As we look for different ways to optimize performance, we should also consider three strategies: SSR (Server-Side Rendering), SSG (Static Site Generation), and CSR (Client-Side Rendering).
-
SSR: the server generates the full HTML when the user visits the page. It’s like a chef cooking everything at the last minute. With too many orders, things can get overwhelmed.
-
SSG: generates HTML pages at build time. It’s like prepping everything ahead so it’s ready as soon as it’s requested.
-
CSR: the server sends an empty (or nearly empty) HTML document to the browser, along with a bunch of JavaScript that builds the full UI in the browser. It’s like being handed ingredients and a recipe and being told: “cook it yourself.”
When to use each one?
SSR:
- When you need dynamic data that changes per user (shopping carts, dashboards, search results).
- When SEO is critical for changing content.
SSG:
- For sites with content that changes little or predictably (blogs, landing pages, documentation), leveraging cache to deliver content extremely fast.
CSR:
- When you need a highly interactive experience, like dashboards or complex applications.
- Note: you may need add-ons to improve SEO or reduce initial load time.
Optimizing API calls
We don’t only improve performance and interaction from the front—we also need to pay attention to how we talk to the back. Optimizing how we make requests is essential for performance, because we can create bottlenecks, increase response delay, and overload the server.
What we can do:
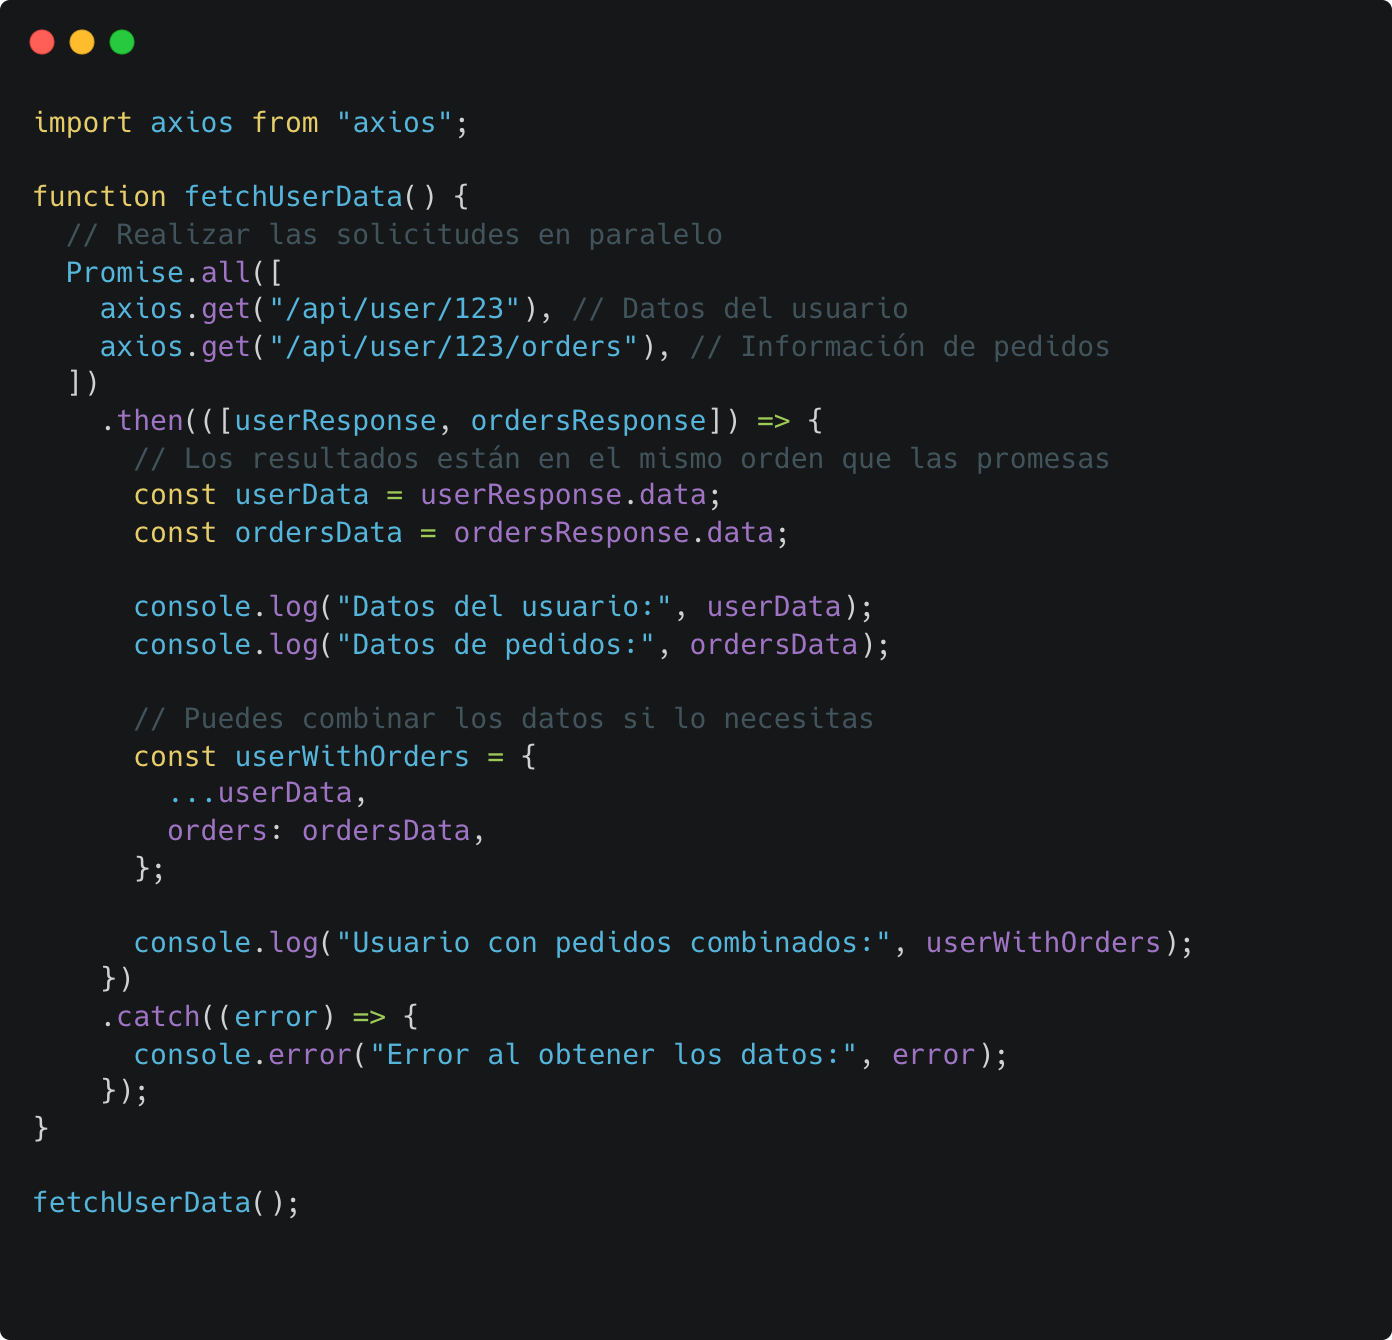
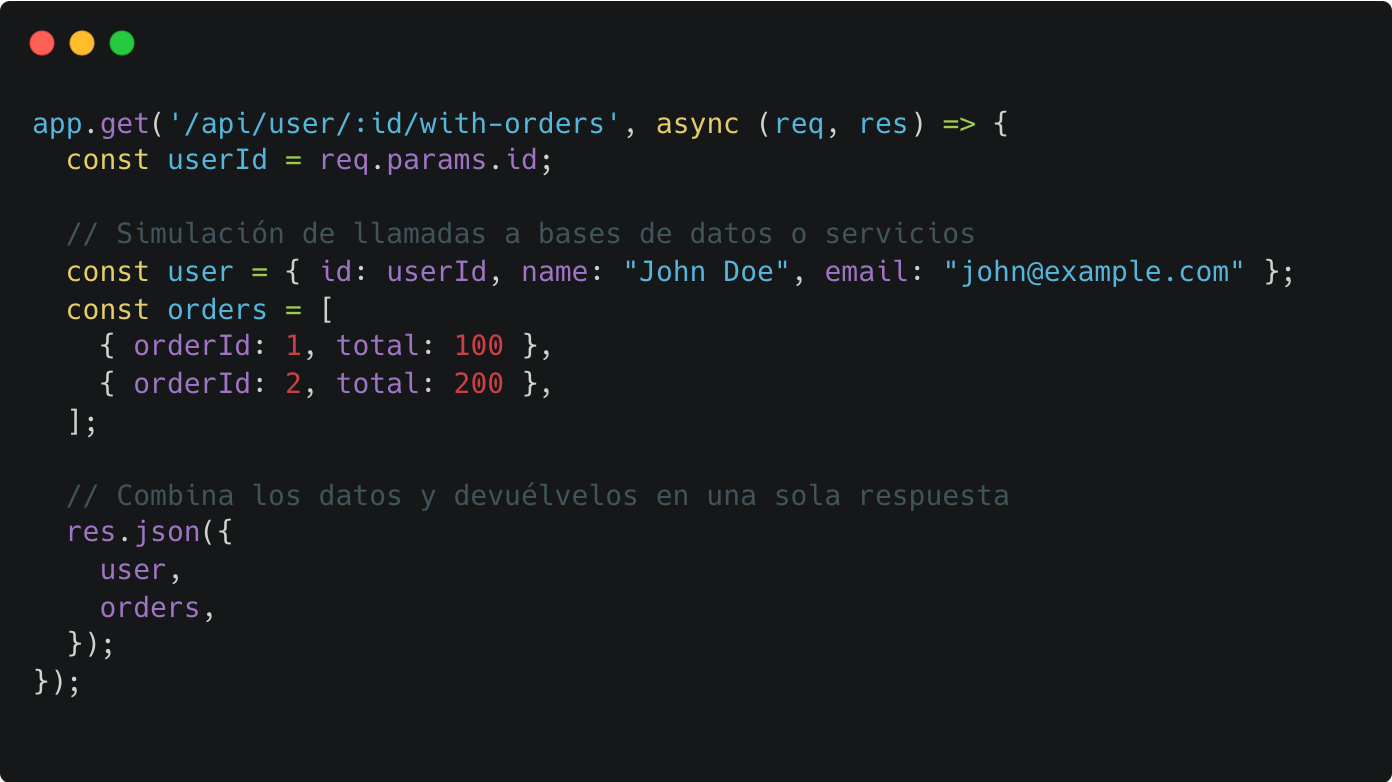
- Batching: combine several requests into one. Instead of sending multiple requests, group them into a single call.
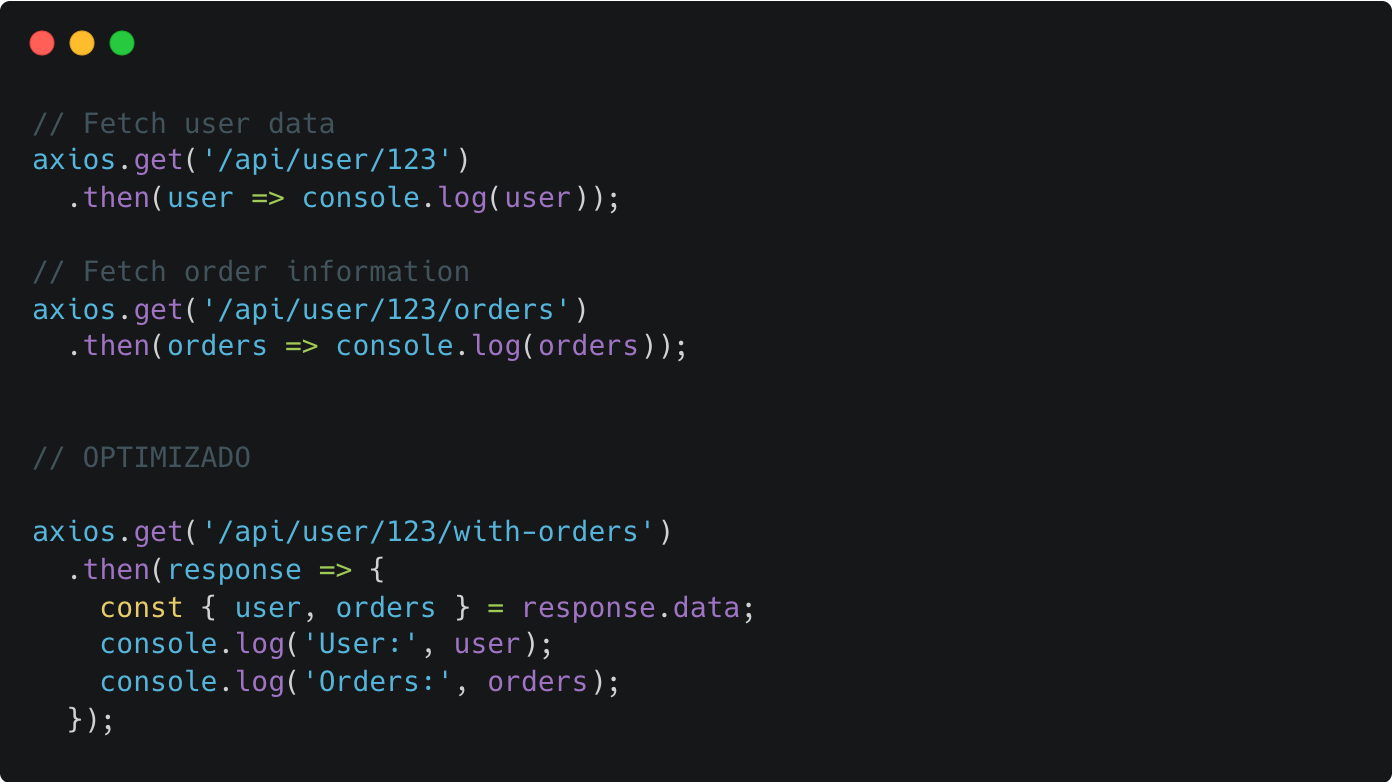
From the front we can do:
And from the back, if we have access and can modify it:
-
Caching: store common data in memory/local (as we mentioned before, but here we cache data instead of assets).
-
Lazy loading: load data only when it’s needed, just like with images.
Tools to measure and improve
Now that you know what to do, you need tools to tell whether you’re doing it right. My favorites:
-
Chrome DevTools: an essential tool for finding performance bottlenecks on your site. With the Performance tab, you can analyze which tasks are taking longer than they should—like script execution or rendering elements. Throttling also lets you simulate real conditions like slow connections or less powerful devices, ideal for diagnosing problems in real-world scenarios. Finally, Lighthouse doesn’t just give you a performance score—it offers clear, actionable recommendations to improve key metrics like LCP, FID, and CLS.
-
WebPageTest: analyze load time from different locations.
-
UnLighthouse: an open-source tool that runs Lighthouse reports on all pages of your site in parallel.
Conclusion
Frontend performance isn’t just a technical topic. If your site isn’t fast, you lose users, money, and opportunities. The good news is that small changes can make a big difference.
My final advice: don’t try to do everything at once. Start with one change. Optimize those heavy images or remove unnecessary scripts.
Originally published on DEV Community.